Big data never looked so good.
IBM
Data Visualizer · Application

A full-featured studio for creating data masterpieces
We delivered a flexible and powerful application to present IBM's information in new and imaginative ways. With an intuitive UX and open API, non-technical users can better identify patterns, connections and relationships within their data — quickly grasping important concepts extracted from IBM's large datasets.
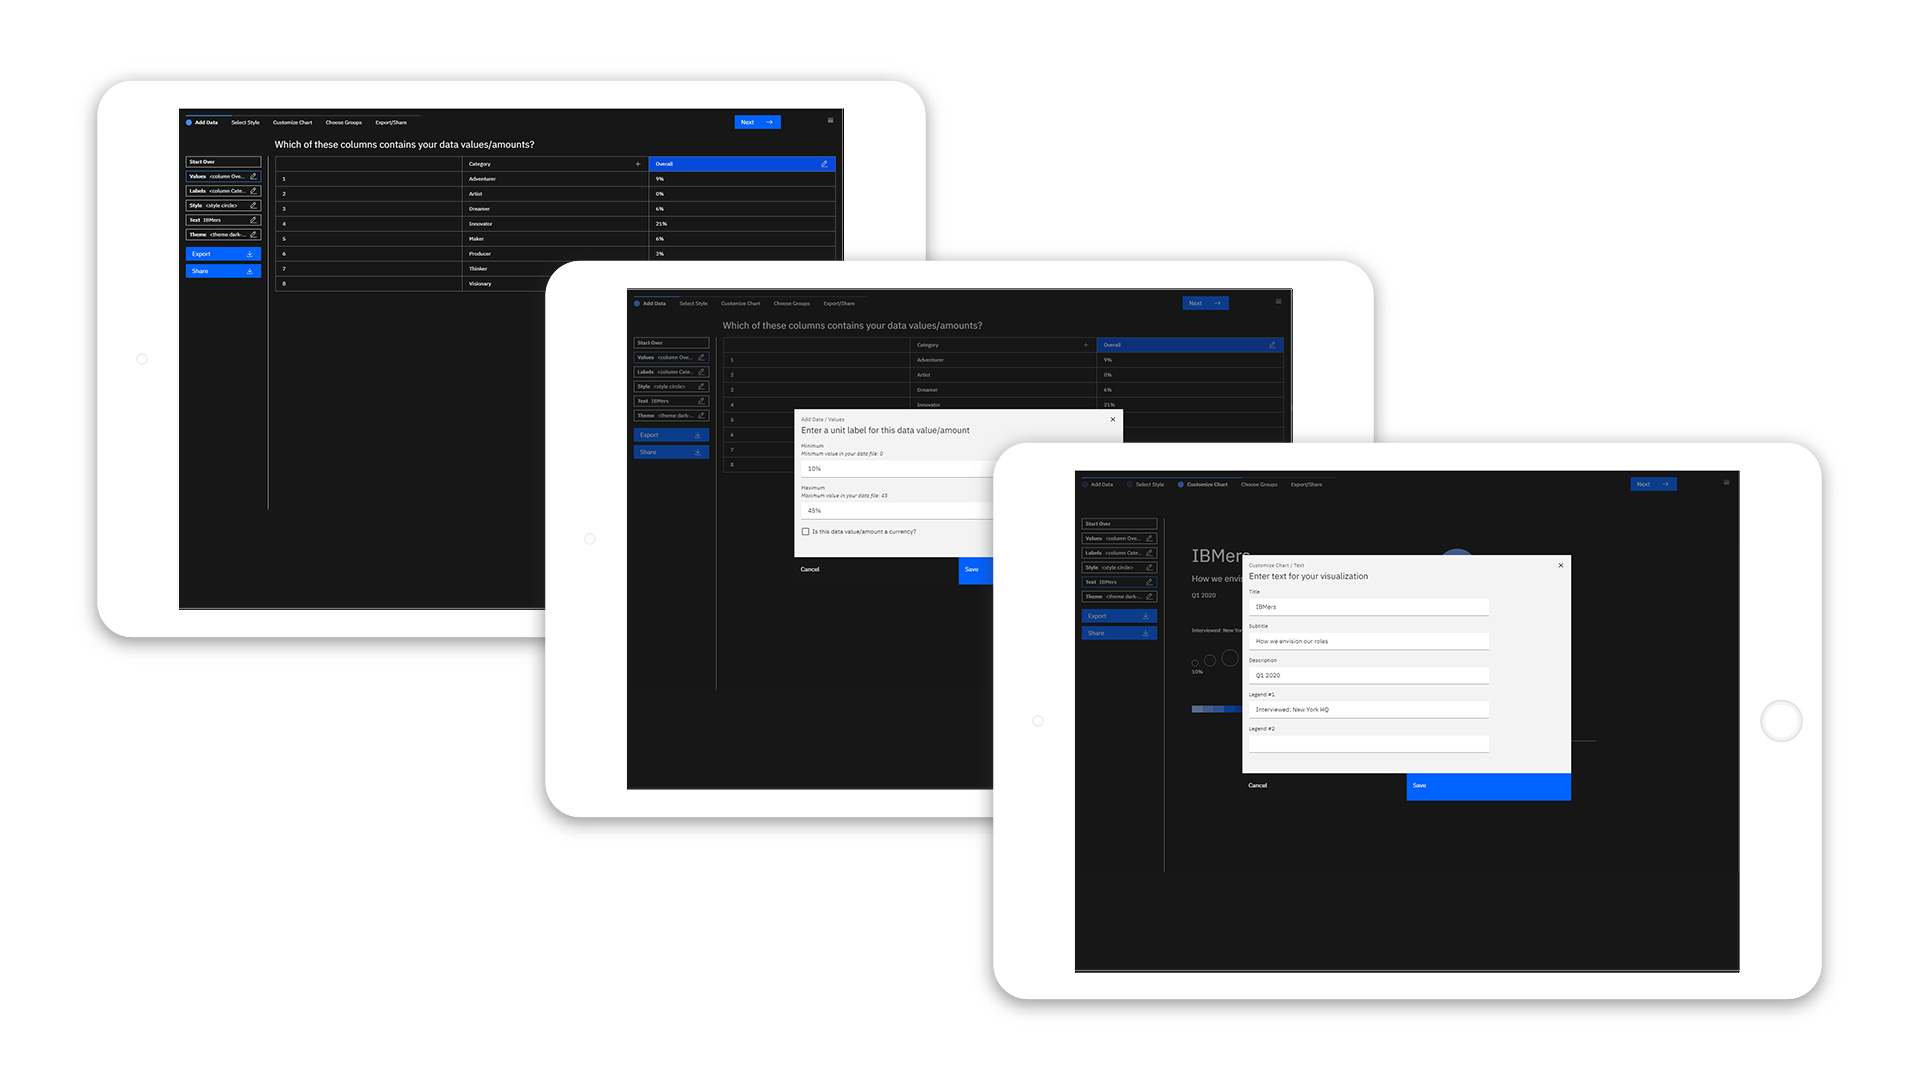
Natural language streamlines the UX
A guided workflow using smart, step-by-step system prompts allows IBM team members to easily create their own compelling visualizations without any technical knowledge. Quick drafts can be made showcasing a variety of charts and styles, all while staying within the IBM organization's well-established graphical standards.

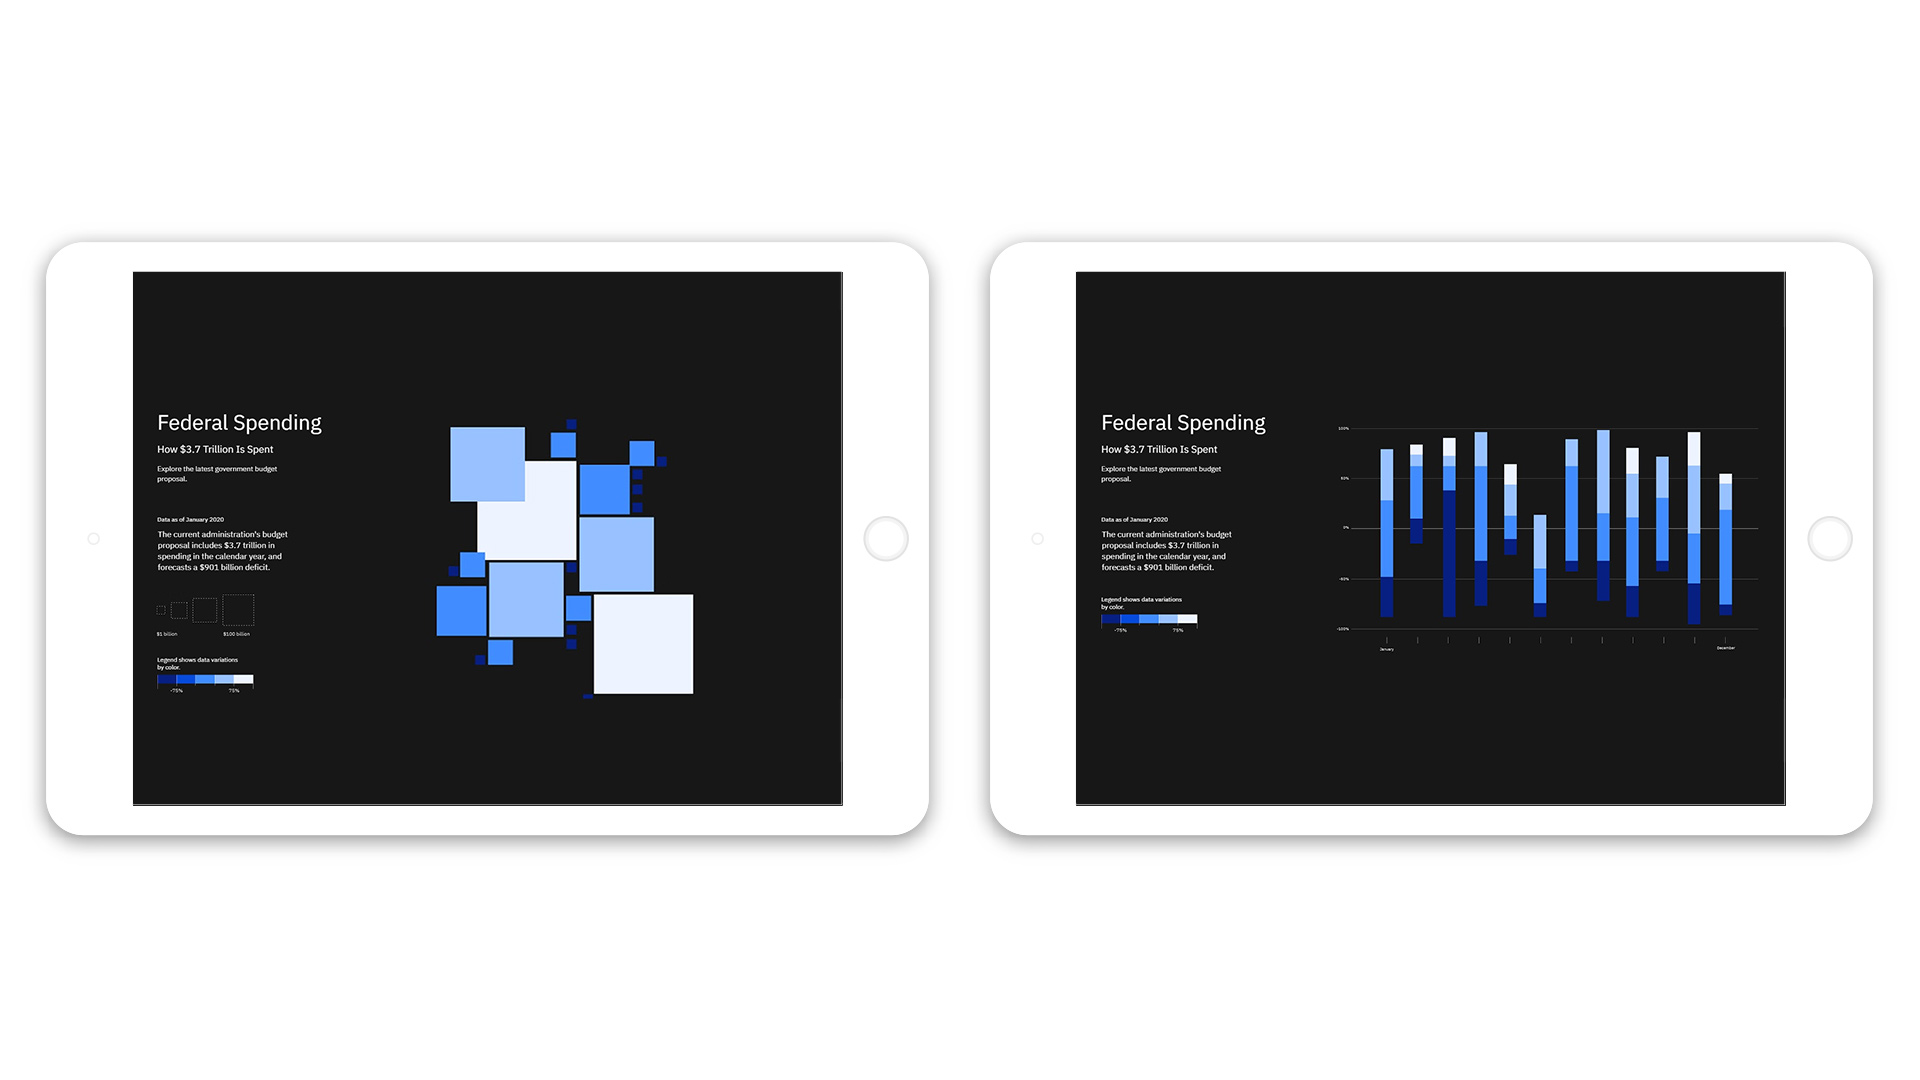
Publish, share, socialize
Finished visualizations can be easily shared and socialized through an open API, allowing easy embedding across the web and on various devices. Native export options are also supported directly inside the app, including a variety of graphical (JPG, PNG, and GIF) and video (MP4, MOV) file formats, allowing convenient and seamless publishing anywhere.


Services
Strategy
- Discovery
- User Stories
- Technical Strategy
- Launch Strategy
Design
- Wireframing
- UI/UX
- Design Animation
Technology
- UI Development
- API Development
- Custom App Development
- Fullstack Development
- Hosting
- Prototyping
- Devops
- Systems Architecture
- Systems Integration
- Creative Coding
- Data Visualization
- Database Engineering
Production
- Technical Direction
- Project Management
- Systems Training
- Quality Assurance
Partner
The Mill